- How to visualize Azure Stack Hub Admin API Metrics in Grafana Dashboard – Part 2
- How to visualize Azure Stack Hub Admin API Metrics in Grafana Dashboard – Part 3
Introduction
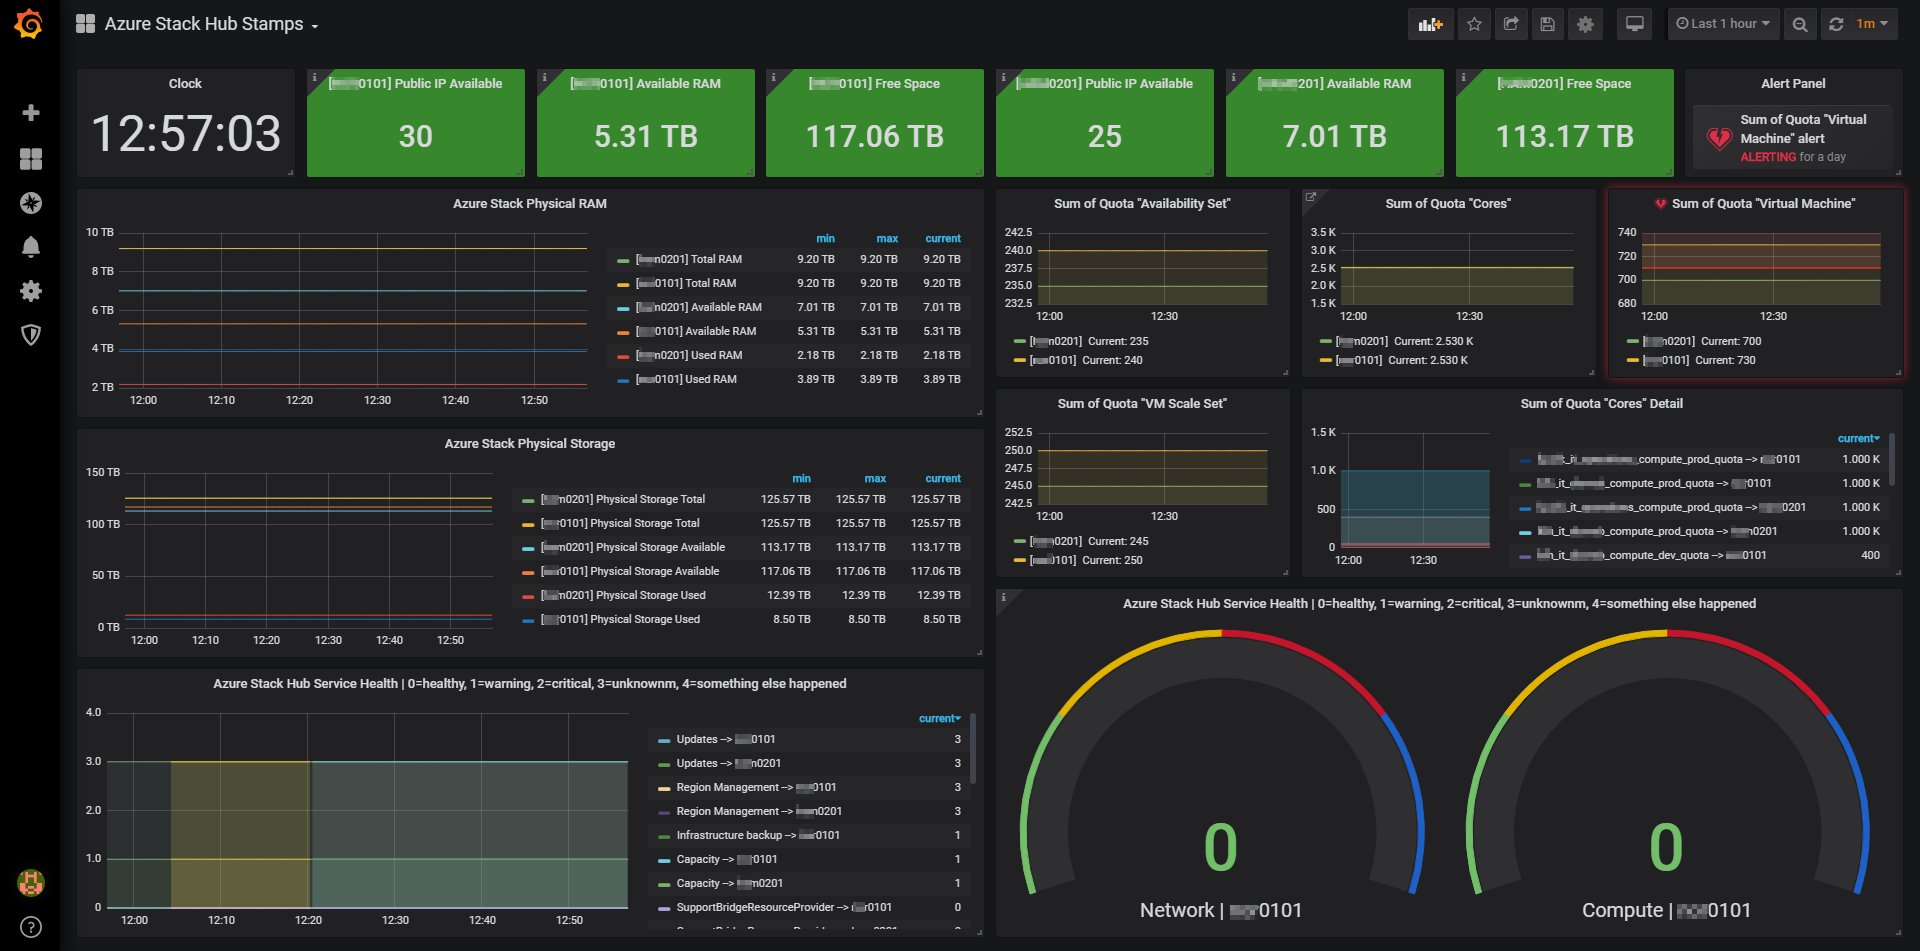
In this multi-part blogpost I will explain how to setup a Grafana Dashboard to visualize Azure Stack Hub Admin API metrics. My goal is a global view over multiple Azure Stack Hub’s in one Dashboard with specific alerting on defined thresholds. As a service provider I don’t want to overprovision quotas. For that prupose I have the need for a global view of how much resources I already offered my customers. I also want to know how much resources are left on my stamps. At some point I may need to consider adding new nodes to my Azure Stack Hub or maybe I even need to buy a new one. Maybe I only have a few public IP’s left, so I need to add a new IP pool.
Dashboard Example:
Documentation
Prerequisites
- Grafana
- Prometheus
- Prometheus Server
- Alertmanager
- Pushgateway
- Windows Server VM for running powershell scripts
- Service User with read only rights to Azure Stack Admin Portal
Steps
- Install Grafana and Prometheus, if you do not already have a installation
- Setup Windows Server VM
- Setup service principal for Azure Stack Admin Portal
- Create powershell script to get data
- Create Scheduled Task for running the script in a reasonable interval
- Create Dashboard
- Create Alerts in Dashboard
- Create Alerts in Prometheues Alertmanager
Install Grafana and Prometheus
You should set up grafana and prometheus in a way which suits your environment best. There are tons of blogposts on how to set up grafana and prometheus.
Grafana and Prometheus both have a very good documentation:
GitHub Grafana
GitHub Prometheus
The easiest way for sure is to host both as a container in a linux environment. I myself chose to install both as a Windows Service on a Windows Server 2019. I always wanted to see how it works and how it performs. The main benefit is that you do not need Linux know-how to support your installation in case you need to add more storage etc.
Setup service principal for login
There is a very good Microsoft documentation for setting up service principals in Azure AD:
powershell
portal
Create powershell script to get data
To visualize data in Grafana you need to extract Azure Stack Admin API metrics and push them to prometheus.
For that purpose I set up a powershell script with the following features:
- Login to the Azure Stack Admin API with a specific Service User
- Get Azure Stack Admin metrics needed
- Build prometheues exposition format around the metrics
- Push metrics to prometheues
Prometheus exposition format
The difficulty is defining the correct metrics and meta data. You need to consider by which properties you will need to filter or group.
Prometheus exposition format
General example for the exposition format:
# HELP http_requests_total The total number of HTTP requests.
# TYPE http_requests_total counter
http_requests_total{method="post",code="200"} 1027 1395066363000
http_requests_total{method="post",code="400"}    3 1395066363000
Azure Stack Hub metric example
azs_physical_storage{instance="yourInstance",job="azs-admin-metrics",location="yourLocation",unit="TB",valueName="Available"}	115.77878887951374
azs_physical_storage{instance="yourInstance",job="azs-admin-metrics",location="yourLocation",unit="TB",valueName="Used"}	9.78657977283001
You may want to label things like AzureStackLocation, ID’s, resource provider names, etc.
This blog was… how do you say it? Relevant!! Finally I have
found something that helped me. Appreciate it!
I’m really impressed together with your writing talents as neatly as with
the structure in your weblog. Is this a paid theme or did you modify it
your self? Either way stay up the excellent quality writing, it is uncommon to look a great weblog like this
one these days.
I went over this web site and I conceive you have a lot of superb info, bookmarked (:
.
When someone writes an piece of writing he/she maintains the thought of a user in his/her mind that how a user can understand it.
So that’s why this piece of writing is perfect. Thanks!
Just wish to say your article is as amazing. The clearness to
your post is just nice and that i could think
you are an expert in this subject. Well with your permission allow
me to grab your RSS feed to stay updated with approaching post.
Thanks a million and please keep up the rewarding work.
I’ve recently started a blog, the information you provide on this site has helped me greatly.
Thanks for all of your time & work.
Hey there! Someone in my Facebook group shared this website with us so I came to
give it a look. I’m definitely loving the information. I’m bookmarking and will be tweeting this
to my followers! Terrific blog and brilliant design.
Heya i am for the first time here. I found this board and I find It truly useful & it helped me out a lot. I hope to give something back and aid others like you aided me.